library(TailRiskAnalyzer)
library(ggplot2)
library(dplyr)
#>
#> Attaching package: 'dplyr'
#> The following objects are masked from 'package:stats':
#>
#>     filter, lag
#> The following objects are masked from 'package:base':
#>
#>     intersect, setdiff, setequal, union
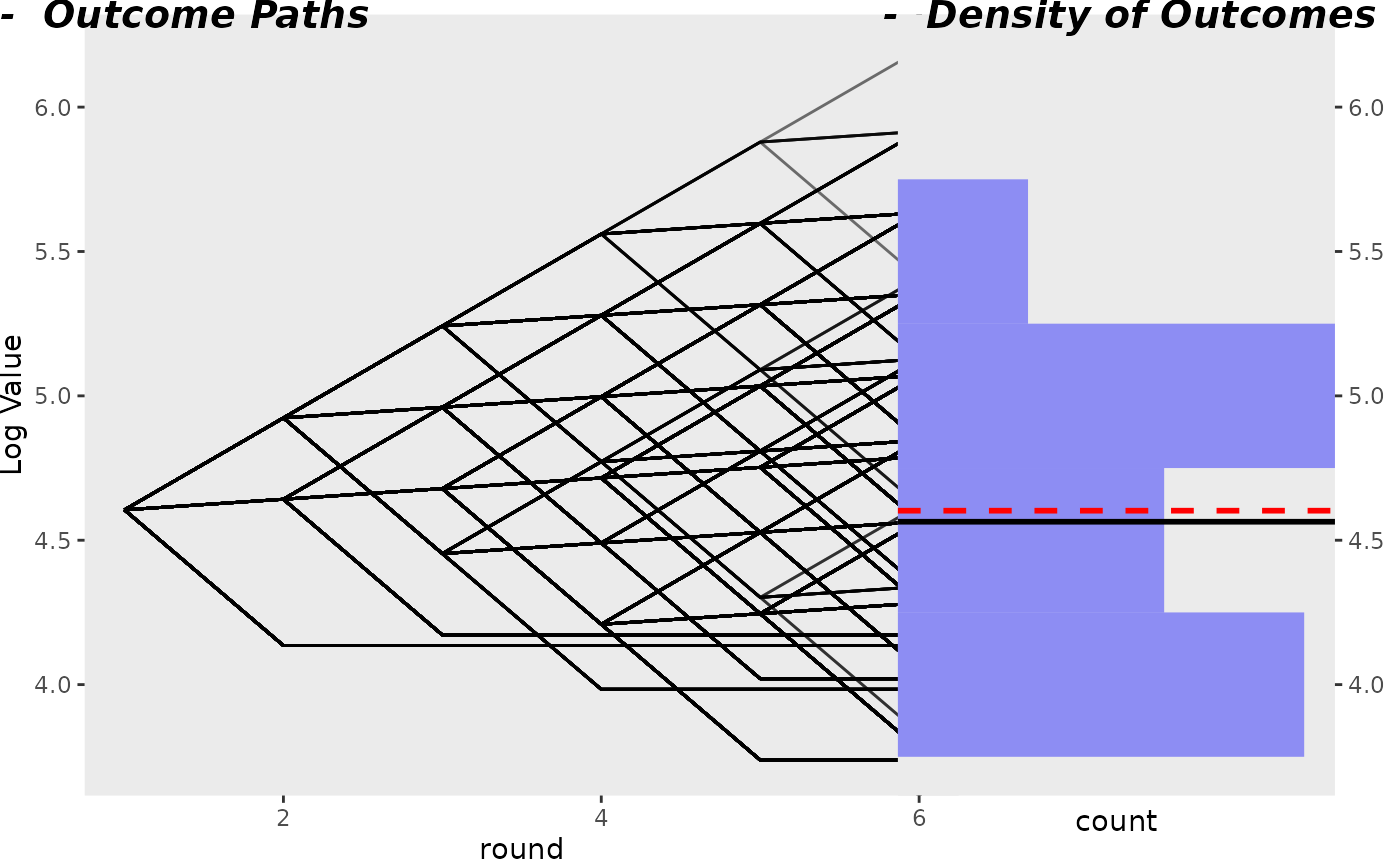
Sample of possible outcomes
# create empty dataframe with 2 columns, index, and value
df <- data.frame(
  index = integer(),
  round = integer(),
  value = double()
)

num_lines <- 1000
for (i in 1:num_lines) {
  cur_run <- die_game_seq(4, 6, payoffs = c(0.5, 1.5, 1.05, 1.05, 1.05, 1.05))
  for (round in seq_along(cur_run$results)) {
    value <- cur_run$results[round]
    df <- df |> add_row(index = i, round = round, value = value)
  }
}

create_side_by_side_plot(df)
#> [1] "median 4.80033084266582"
#> [1] "mean 4.56443456702112"
#> Warning: Removed 2 rows containing missing values or values outside the scale range
#> (`geom_bar()`).
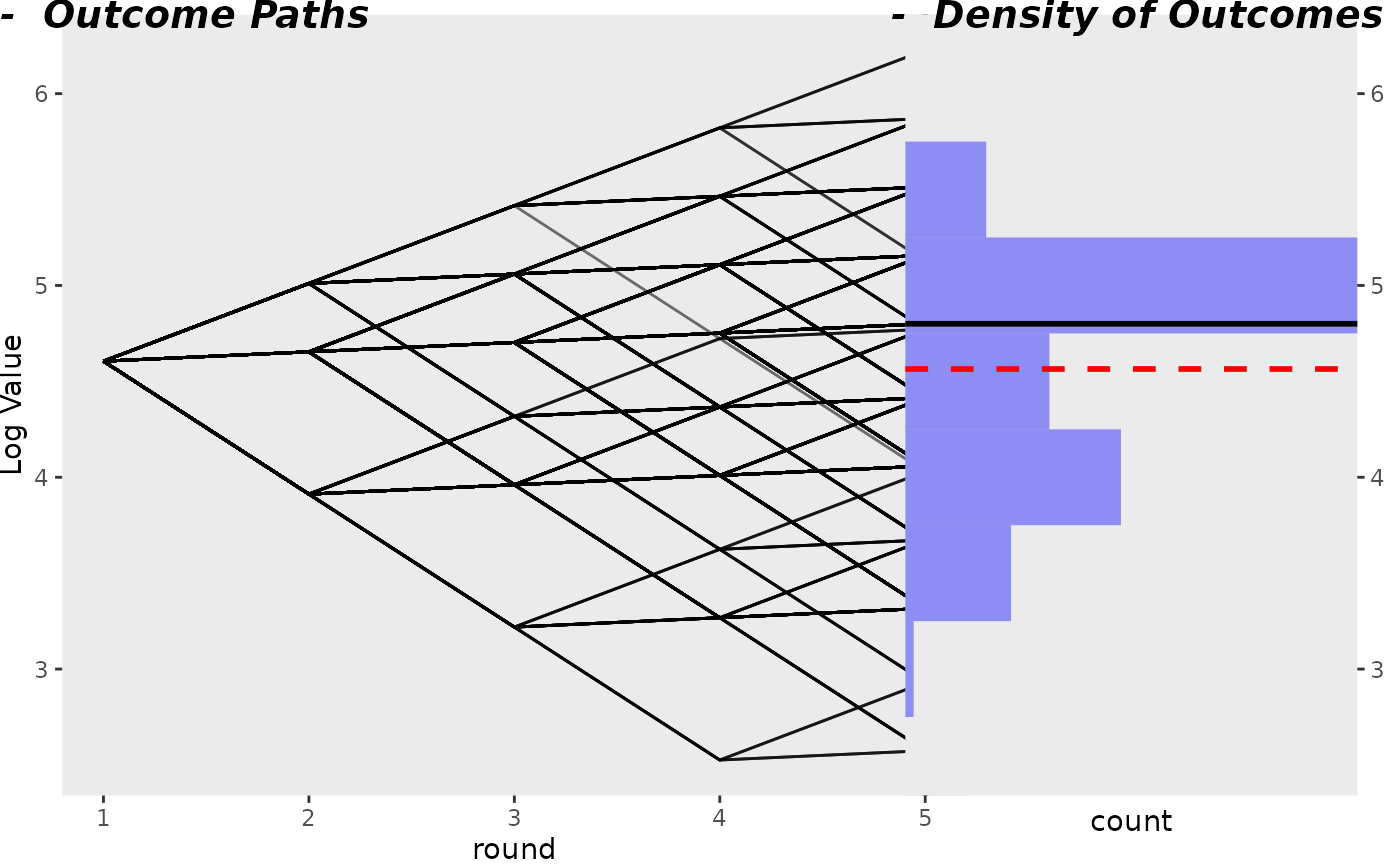
Theoretical Dice Game with all possibilities present in proper
proportion
toss_result_list <- generate_die_sequences(5, 6)
# toss_result_list

df <- data.frame(
  index = integer(),
  round = integer(),
  value = double()
)

# iterate over rows of toss_result_list
for (i in seq(from = 1, to = nrow(toss_result_list))) {
  # print(i)
  cur_run <- calc_score_for_die(toss_result_list[i, ],
    payoffs = c(0.5, 1.5, 1.05, 1.05, 1.05, 1.05),
    min_bet = 50, betting_fraction = 0.75
  )
  for (round in seq_along(cur_run)) {
    value <- cur_run[round]
    df <- df |> add_row(index = i, round = round, value = value)
  }
}

create_side_by_side_plot(df)
#> [1] "median 4.56406220722904"
#> [1] "mean 4.60232960407023"
#> Warning: Removed 2 rows containing missing values or values outside the scale range
#> (`geom_bar()`).