library(TailRiskAnalyzer)
library(ggplot2)
library(dplyr)
#>
#> Attaching package: 'dplyr'
#> The following objects are masked from 'package:stats':
#>
#>     filter, lag
#> The following objects are masked from 'package:base':
#>
#>     intersect, setdiff, setequal, union
# create empty dataframe with 2 columns, index, and value
df <- data.frame(
index = integer(),
round = integer(),
value = double()
)
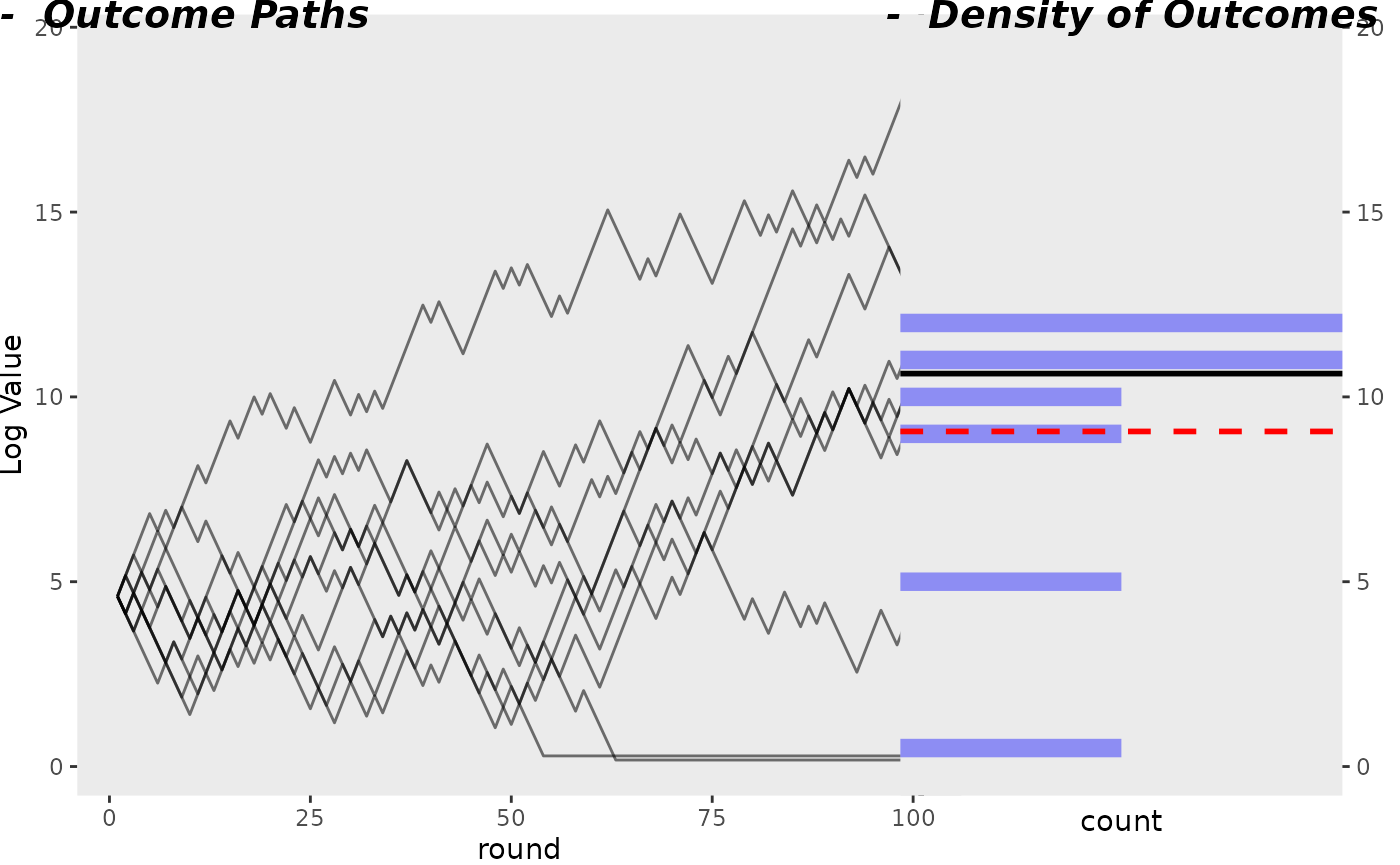
num_lines <- 10
for (i in 1:num_lines) {
cur_run <- coin_toss_seq(100, min_bet = 1, betting_fraction = 0.75)
for (round in seq_along(cur_run$results)) {
value <- cur_run$results[round]
df <- df |> add_row(index = i, round = round, value = value)
}
}
# get_kelly_bet(0.5, 0.5, 2)
create_side_by_side_plot(df)
#> [1] "median 10.6302072462442"
#> [1] "mean 9.06529324205468"
#> Warning: Removed 2 rows containing missing values or values outside the scale range
#> (`geom_bar()`).
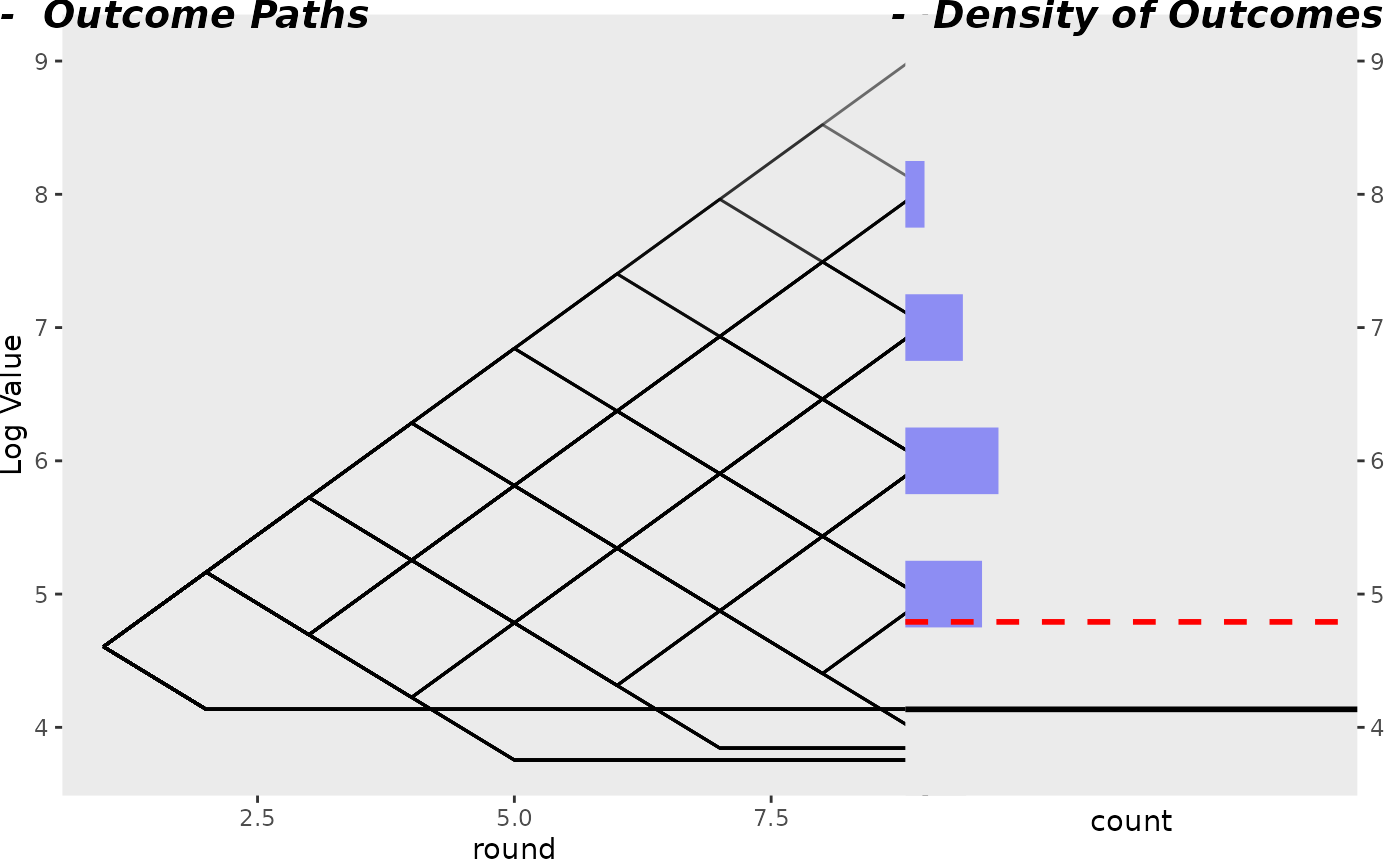
Theoretical Distribution, based on all possible outcomes
toss_result_list <- generate_coin_sequences(8)
# toss_result_list

df <- data.frame(
  index = integer(),
  round = integer(),
  value = double()
)

# iterate over rows of toss_result_list
for (i in seq(from = 1, to = nrow(toss_result_list))) {
  # print(i)
  cur_run <- calc_score_for_coin_game(toss_result_list[i, ],
    min_bet = 50, betting_fraction = 0.75
  )
  for (round in seq_along(cur_run)) {
    value <- cur_run[round]
    df <- df |> add_row(index = i, round = round, value = value)
  }
}

create_side_by_side_plot(df)
#> [1] "median 4.13516655674236"
#> [1] "mean 4.7913954532651"
#> Warning: Removed 2 rows containing missing values or values outside the scale range
#> (`geom_bar()`).